
Surface pressure charts, also known as synoptic charts or simply “weather charts”, are a great source of meteorological information for sailors like you and me.
Learning how to read and analyse the information in weather charts will help you predict the wind direction and wind speed, as well as forecast the weather and sea conditions.
Checking the weather charts should be an important part of your preparation routine before you go sailing. You can get accurate surface charts from the Met Office here in the UK, from the National Weather Service in the USA, and other similar weather forecasting authorities around the world.
Here’s an example of how a weather chart updates and changes in 12 hour increments.
How to Read a Weather Chart
When you look at a weather chart, there are some important features that you will immediately notice and need to understand so that you can interpret the chart and predict the weather.
The circular lines on the weather chart are called isobars, and connect areas with the same barometric pressure (air pressure) values. Barometric pressure is measured in millibars and is represented by the numbers you see on the weather chart.
Isobars on a weather chart are similar to contour lines on a terrain map, and help us identify high and low pressure systems. The isobars form concentric circles around high and low pressure systems.
The thicker black lines on the chart above, which may be red or blue in colour charts, signify weather fronts. The triangles and semi-circles on these lines identify them as being warm fronts, cold fronts, stationary fronts, or occluded fronts.
I’ll explain more about the different types of weather front later in this article.
How to Predict Wind Direction from a Weather Chart
The movement of air around a high pressure system is known as an anticyclone and happens in a clockwise direction in the Northern Hemisphere, and an anti-clockwise direction in the Southern Hemisphere.
In comparison, the movement of air in a low pressure system is known as a cyclone and occurs in an anti-clockwise direction in the Northern Hemisphere, and a clockwise direction in the Southern Hemisphere.
To predict the wind direction from a pressure chart, plot your location on the chart and draw a straight line through your location, parallel to the nearest isobar. Look to see if the nearest weather system is a high or low pressure system, as this will determine which way along your line you have drawn the air is moving. This will give you the wind direction.
Remember: In the Northern Hemisphere, the flow of air moves in a clockwise direction around high pressure systems, and anti-clockwise around low pressure systems. The opposite is true in the Southern Hemisphere.
The video below demonstrates in more detail how you can predict the wind direction from a pressure chart.
How to Predict Wind Speed from a Weather Chart
The isobars on a weather chart will help you to predict wind speed.
Air moves from areas of high pressure to areas of low pressure. The closer together a set of isobars, the steeper the pressure gradient is in that area of the weather system.
The steeper the pressure gradient, the faster air will move from high to low pressure areas, thus producing faster wind speeds.
Remember: The closer the isobars get to each other, the stronger the wind!
What are Fronts on a Weather Chart?
The thick black lines on a weather chart signify weather fronts. A weather front is the borderline between different air masses.
Weather fronts occurs when two or more air masses with different temperatures and humidities meet at the earth’s surface. This creates a transition zone and turbulence where the two air masses come together.
For example: Warm fronts occur when warm air advances on a body of cold air, forcing the warm air to rise. This forced rising of the warm air causes moisture held in the warm air to condense and form clouds, potentially leading to rainfall.
Lets take a look at the different types of weather front.
Warm Fronts
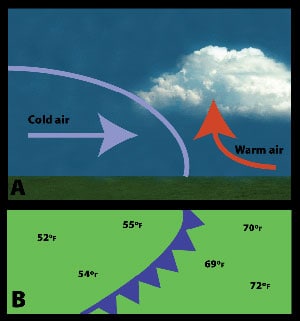
A warm front forms when a warm air mass pushes into a cooler air mass, as shown in the image below (A).
Warm fronts often bring stormy weather as the warm air mass at the surface rises above the cool air mass, making clouds and storms.
Credit: Lisa Gardiner
You will often see high clouds like cirrus, cirrostratus, and middle clouds like altostratus ahead of a warm front. These clouds form in the warm air that is high above the cool air. As the front passes over an area, the clouds become lower, and rain is likely.
There can be thunderstorms around the warm front if the air is unstable.
On weather maps, the surface location of a warm front is represented by a solid red line with red, filled-in semicircles along it, like in the map above (B).
The semicircles indicate the direction that the front is moving. They are on the side of the line where the front is moving.
Cold Fronts
A cold front forms when a cold air mass pushes into a warmer air mass. Cold fronts can produce dramatic changes in the weather.
As a cold front moves into an area, the heavier (more dense) cool air pushes under the lighter (less dense) warm air, causing it to rise up into the troposphere.
Lifted warm air ahead of the front produces cumulus or cumulonimbus clouds and thunderstorms, like in the image below (A).
Credit: Lisa Gardiner
As the cold front passes, winds become gusty. There is a sudden drop in temperature, and also heavy rain, sometimes with hail, thunder, and lightning.
Atmospheric pressure changes from falling to rising at the front.
After a cold front moves through your area, you may notice that the temperature is cooler, the rain has stopped, and the cumulus clouds are replaced by stratus and stratocumulus clouds or clear skies.
On weather maps, a cold front is represented by a solid blue line with filled-in triangles along it, like in the map above. The triangles are like arrowheads pointing in the direction that the front is moving.
Stationary Fronts
A stationary front forms when a cold front or warm front stops moving. This happens when two masses of air are pushing against each other, but neither is powerful enough to move the other.
Winds blowing parallel to the front instead of perpendicular can help it stay in place.
Credit: Lisa Gardiner
A stationary front may stay put for days. If the wind direction changes, the front will start moving again, becoming either a cold or warm front. Or the front may break apart.
On a weather map, a stationary front is shown as alternating red semicircles and blue triangles like in the image at the left. Notice how the blue triangles point in one direction, and the red semicircles point in the opposite direction.
Occluded Fronts
Sometimes a cold front follows right behind a warm front.
A warm air mass pushes into a colder air mass (the warm front), and then another cold air mass pushes into the warm air mass (the cold front). Because cold fronts move faster, the cold front is likely to overtake the warm front. This is known as an occluded front.
Credit:Lisa Gardiner
At an occluded front, the cold air mass from the cold front meets the cool air that was ahead of the warm front. The warm air rises as these air masses come together.
Occluded fronts usually form around areas of low atmospheric pressure.
There is often rain or other precipitation along an occluded front from cumulonimbus or nimbostratus clouds. Wind changes direction as the front passes and the temperature either warms or cools. After the front passes, the sky is usually clearer, and the air is drier.
On a weather map, shown above, an occluded front looks like a purple line with alternating triangles and semicircles pointing in the direction that the front is moving. It ends at a low pressure area shown with a large ‘L’ on the map, begins at the other end when cold and warm fronts connect.